Your social media journey has only just begun.
It’s simple. Social media is an amazing platform to discover your competition and see what they are up to.
The best part? They won’t even know that you’re stalking them!
Businesses spend lots of money on their online presence, so it makes sense that taking a peek behind the curtain would be very insightful.
Why Do You Need to Conduct Competitive Research?
Your competitors are already spending time and money on marketing, so it’s a matter of checking out what they’re doing with their marketing budgets.
You can check:
- How frequently the business is posting on Facebook and Twitter
- The number of followers and fans they have on each platform
- How they are marketing their website
- What kinds of content are they sharing on each platform?
- Is there a pattern you can learn from?
- What kind of offers do they make, if any at all?
- How are they engaging with their customers?
The list goes on and on.
Once you arm yourself with this information, you’ll be able to discover what works for them and apply it for your own benefit.
So, why do you need to conduct competitive research?
Well, competitive research accomplishes the following:
- Outlines the tactics that are working most effectively for your competitors (as well as what’s getting them attention)
- It gives you insight into who you’re up against and how they are marketing to their customers
- It shows you where your competitors are investing their time and money.
- Allows you to make the best use of your resources
- Spark new ideas for your campaign or creative ideas to use social media channels
- Uncover new opportunities or niches never exploited before
- It helps to guide your plans and future direction
- Find out what tactics have worked well for your competitors
- Reveal what channels your competitors are focusing on to get a better idea of their marketing strategy
- Take a deeper look into your competitors’ marketing strategies and see if you can spot any hole in their armours
Using social media For Competitive Research
If you have a business, the chances are good that your business success is dependent almost entirely on how popular your website becomes.
So, it would make sense to learn about what’s working for other businesses in your niche. In doing so, you should get a better picture of what’s going on in your industry.
Here are a few ideas to get you started:
Create a competitive analysis doc
It doesn’t have to be anything complicated.
It doesn’t have to be anything complicated. Just head over to Google Doc or Spreadsheet and create the following setup:

Write the name of your competitors in the first column. It helps to start with your brand, followed by your first competitor. After that, you want to create columns for Facebook, Twitter, Instagram, and any other social media channel you want to track.
On Facebook, you’ll want to see the number of followers for each competitor under ‘Likes’ and then highlight their posts that received a lot of engagement over a specific period. You should include how often they post as a column too.
Which Social Media Channels Are They On?
Before anything, find out which social media channels your competitors are on.
Simple, visit their website and look for social media icons. However, there are times when a company may fail to update its social media information.
If you still can’t find any information, the best bet is to search for them on respective social media channels.
If they have a Twitter account, the username will often be their company name. If you can’t find them on Twitter, try Facebook or Instagram.
The next thing you want to do is record the results in the competitive analysis doc.

You also want to pay special attention to unexpected social media channels that any of your competitors happen to be highly active on, such as Tumblr, Snapchat.
And just because one of your competitors is present on a particular social media channel, that doesn’t mean you should be there too.
Facebook Analysis
Starting with Facebook, you want to record the number of Likes they have, their number of posts per week/month, and their posting frequency (once per day, multiple times a day, ad hoc, etc.).
Next, you want to note the posts that received a high number of Likes and comments.
If your competitors have published any Facebook Ads, be sure to include those as well.
In addition, if they’ve been using any organic or paid marketing tactics, which you haven’t tried yet (for example, boosted posts), jot those down as well.
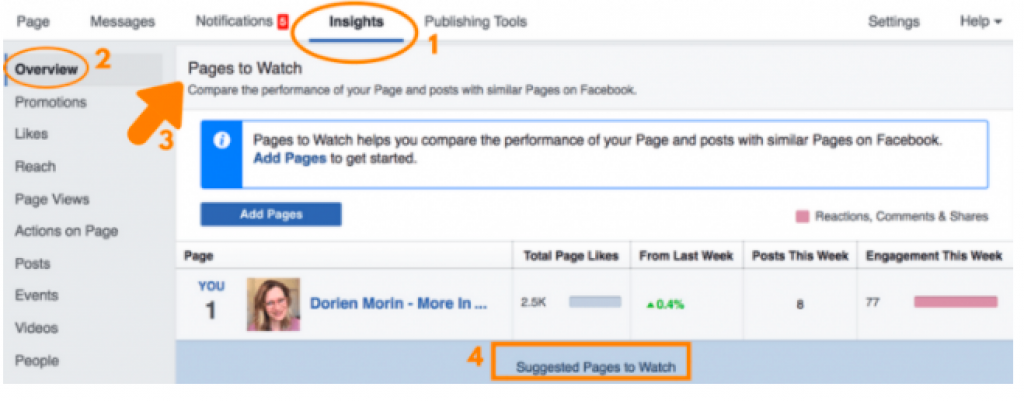
Facebook has the “Page’s to Watch” feature within Facebook Insights that lets you keep an eye on your competitors. Note that you need to be the page admin and have at least 100 likes on your page to use this feature.
To find this feature, head over to your Facebook page:
- On the left-hand sidebar, scroll down until you find “Insights.”
- Click on Insights, but stay in the overview section. Now scroll down until you get to “Pages to Watch,” found at the bottom of the page.
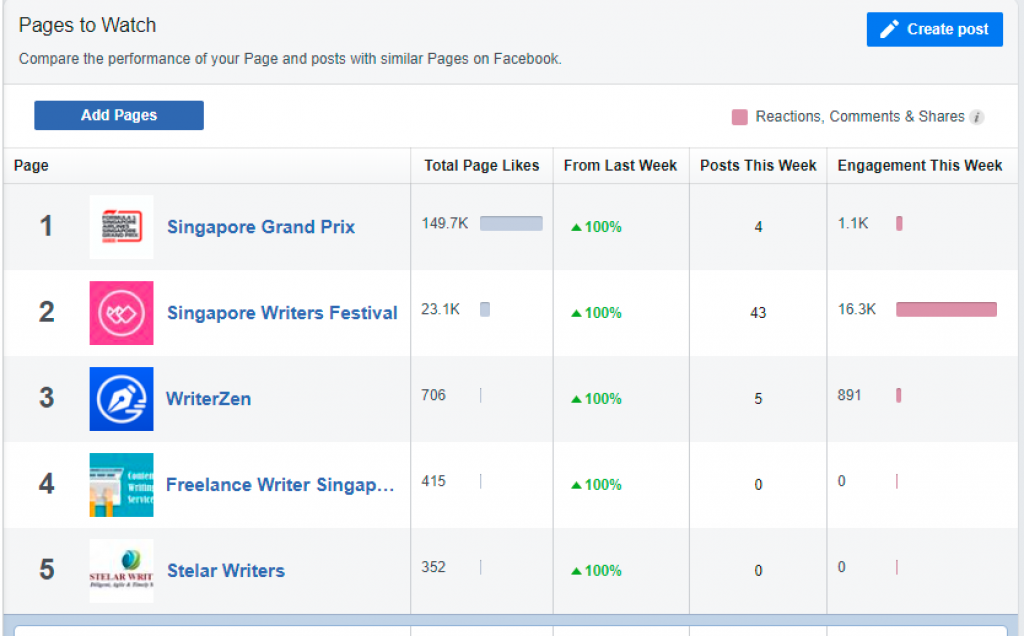
- Click on ‘Add Pages’ and enter your industry keywords to search for your competitors’ page to spy on.
- Click on “Watch Page” for every page you want to track. Click done once you’ve entered enough pages.
We suggest you select a few local companies and a few industry competitors. That way, you’ll have two different metrics to track.
Twitter Analysis
On Twitter, you want to record the number of followers and their posts per week/month, including the posts that received a high number of Likes and Retweets (or Favourites).
If your competitors run any Promoted Tweets or other paid campaigns, be sure to note those as well.
For Twitter, you also want to note their Promoted Accounts and Tweets and the number of Likes and Retweets they got.
To gain in-depth insights into your competitors, you want to use a tool called Twitonomy. Their free version has tons of useful information you can view, even though they have a paid version if you want to dig deeper.
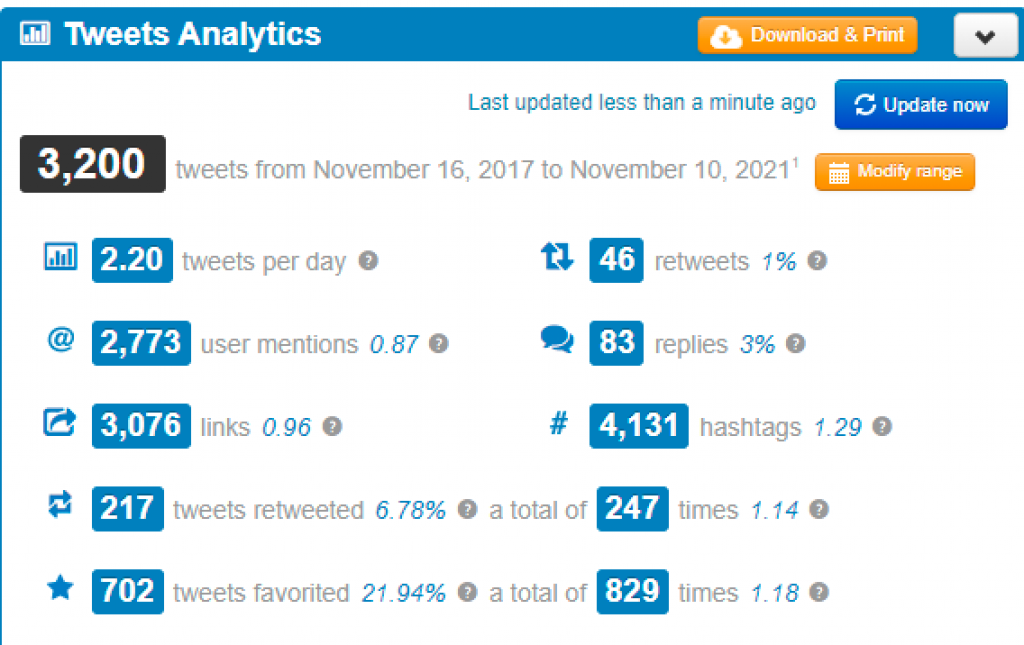
With this tool, you can view the number of tweets shared within a given time frame, the average number of tweets the company makes per day, how many tweets have been favourited and retweeted, and more.
For your competitive analysis doc, you can begin by recording the number of tweets per day and the percentage number of retweets.
Not only that, but Twitonomy has tons of other helpful information you might also want to record. Just scroll down for more info.
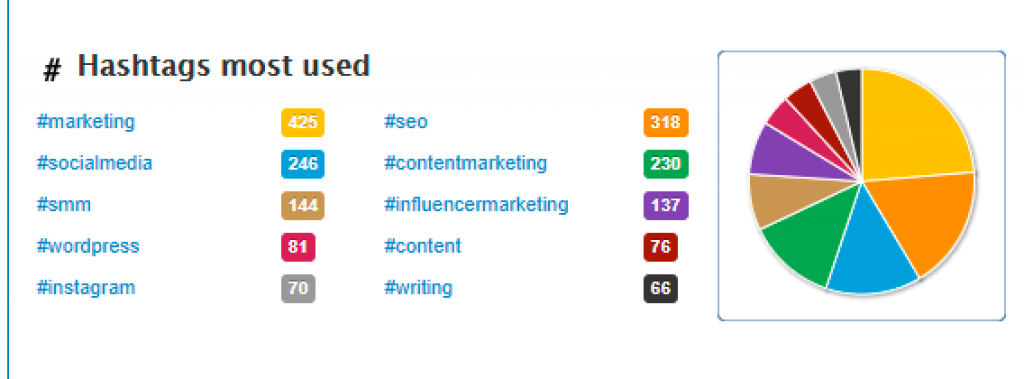
You can also record commonly used hashtags.
You might also want to check tweets most retweeted:
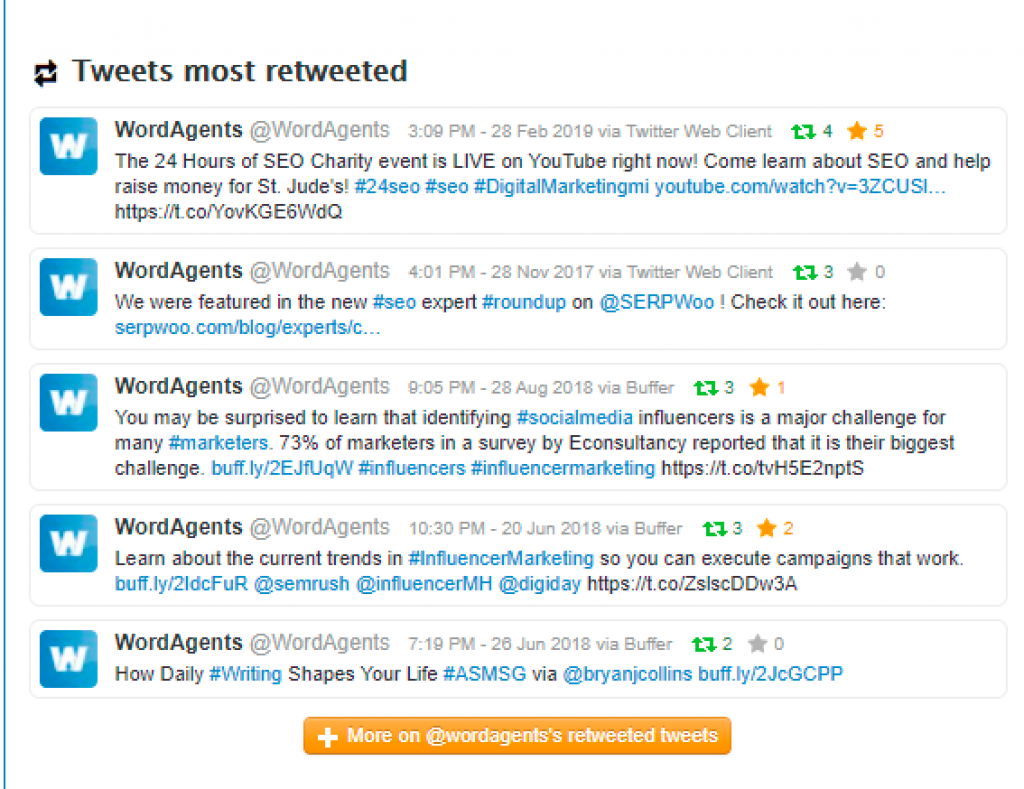
Lastly, don’t exit the page without checking out your competitors’ weekly breakdown of their tweets.
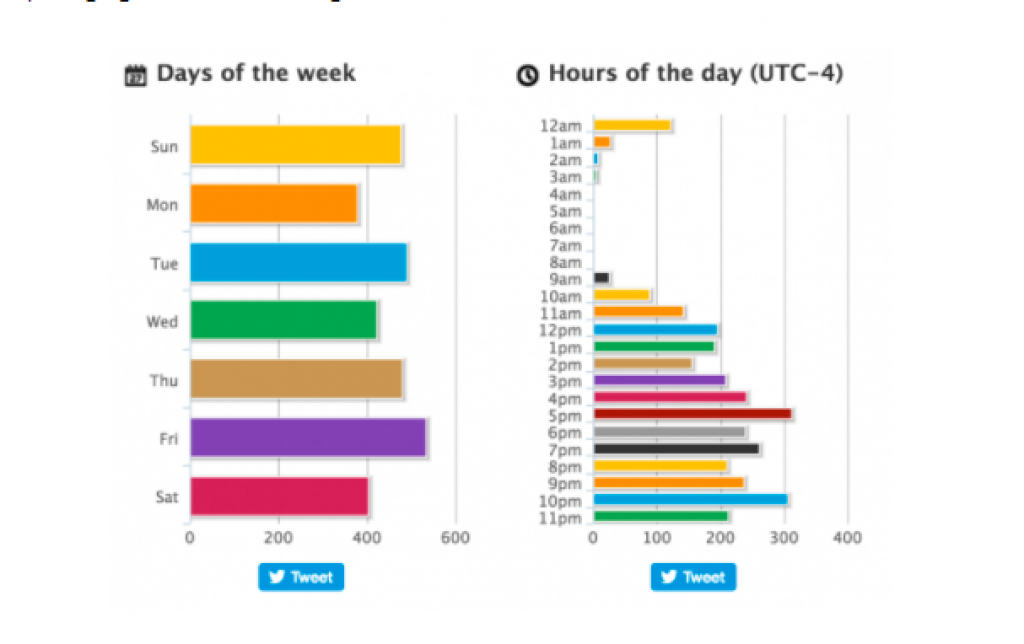
You can even see what users the competitor engages with the most and what time of the day they are most active on the platform.
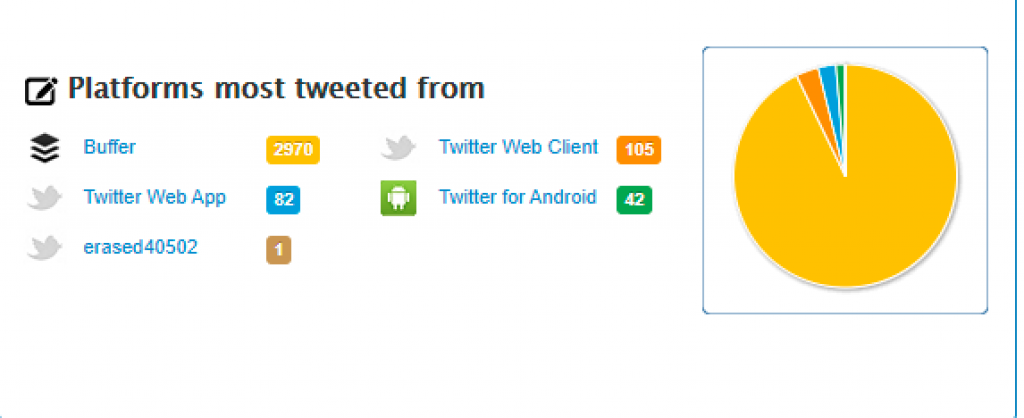
… the devices or platforms most retweeted from.
And again, all this information is available in their free version.
Instagram Analysis
On Instagram, you’re going to be tracking the number of followers they have under ‘Followers,’ and you also want to note the number of likes and comments each post receives.
Whether your competitors are using Instagram Ads, Hashtags, or other paid marketing techniques, be sure to include that in the spreadsheet as well.
You’ll also want to keep track of their top posts on Instagram.
For Instagram analysis, you want to use a tool such as Iconosquare. While it’s a paid tool, you can still use their “brand index” feature to do some highly detailed competitive research for free. Note that this only works if your competitors are large brands.
That’s because Brand Index only catalogues 5000+ brands.
You can search for brands by company name, and the tool will generate their follower count, average post frequency, post on hashtags, and engagement rate for the past 30 days.
If you can’t find a brand-on-Brand Index, then consider searching for this info manually. You can start by recording their follower count and other details.
To calculate their engagement rate, you want to visit their Instagram account and click on the display icon for “Scroll.”
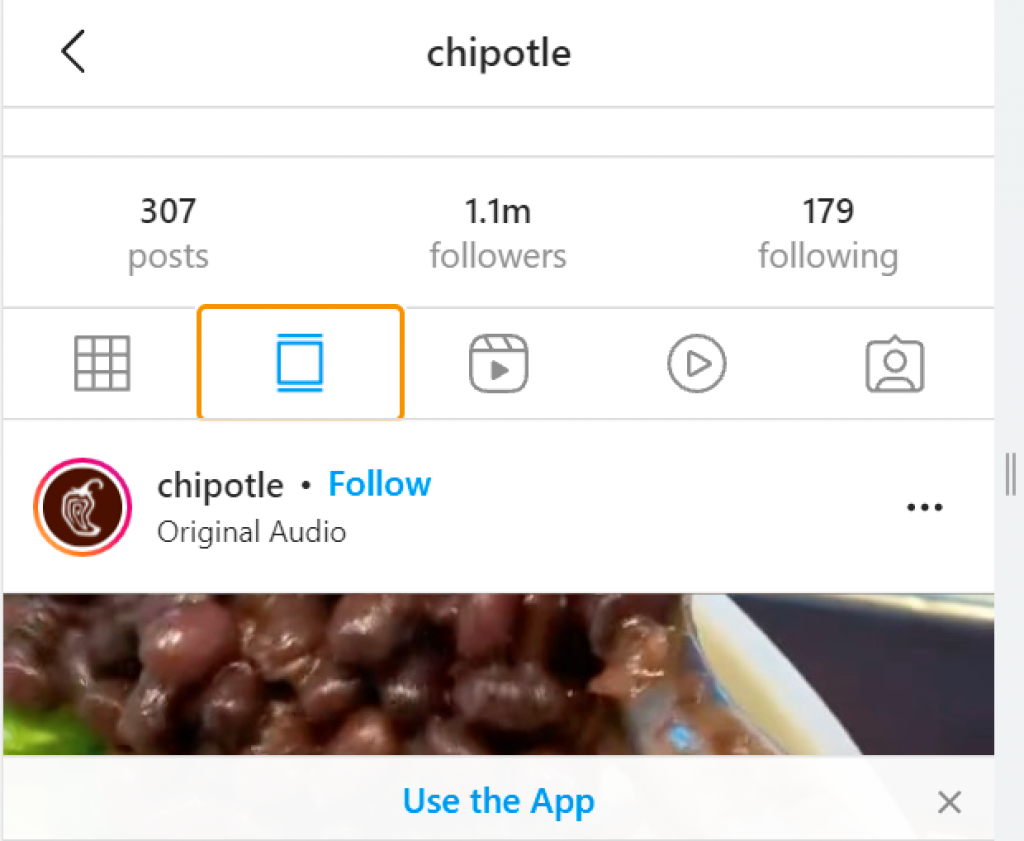
Doing so will allow you to scroll through each post they shared and see the number of comments and likes they have on each post. You can casually calculate their engagement rate and use the same procedure to determine their post frequency.


